At the end of this guide you will be able to…
If you never worked with Testable before, you can check out our 10-minute introduction video here and come back
The Trail Making Test (TMT) originated with Ralph Reitan, who developed it as part of the Army Individual Test Battery (1944) to assess cognitive function in soldiers. Over time, it has become a widely adopted neuropsychological test in clinical and research settings due to its effectiveness in assessing cognitive flexibility, attention, and visual scanning abilities. (Wikipedia)
The TMT has been extensively used in clinical and research settings to assess cognitive flexibility in a wide range of populations, including individuals with traumatic brain injuries, neurodegenerative diseases, psychiatric disorders, and healthy aging.
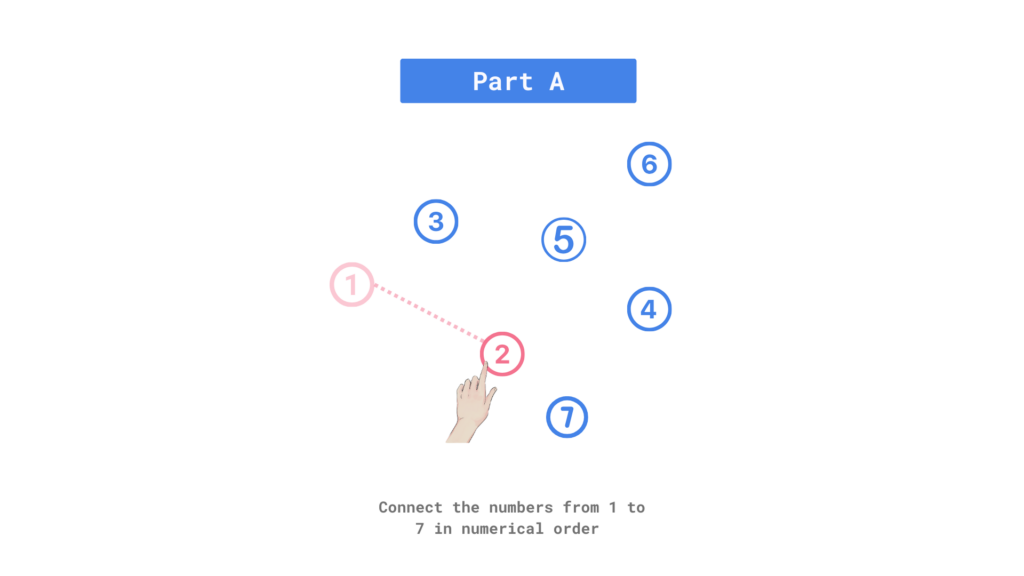
In the TMT, participants go through two tasks, each containing a series of 25 stimuli. In the first task, known as Part A, participants must connect a sequence of numbered circles in ascending order as quickly as possible.This segment primarily assesses visual attention and processing speed.
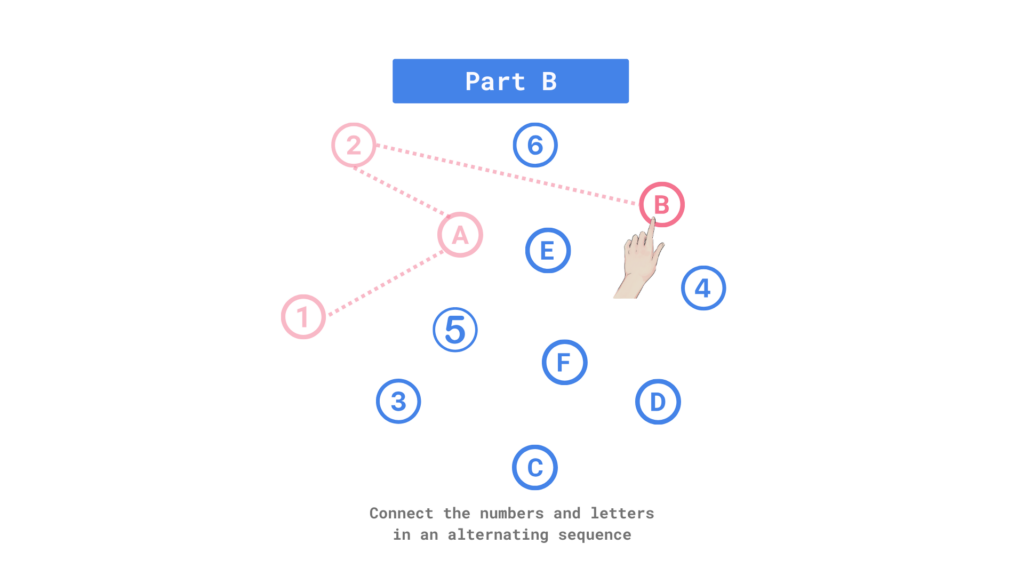
Part B introduces a more complex task. Participants must alternate between connecting numbered circles and lettered circles in ascending order (e.g., 1-A-2-B). This task requires participants to exhibit cognitive flexibility and the ability to maintain and switch between different mental sets.
One of the most significant observations from the TMT is the presence of what’s known as “switch costs“. It represents the additional time and cognitive effort required to switch between tasks or mental sets, compared to when we’re performing the same task repeatedly.
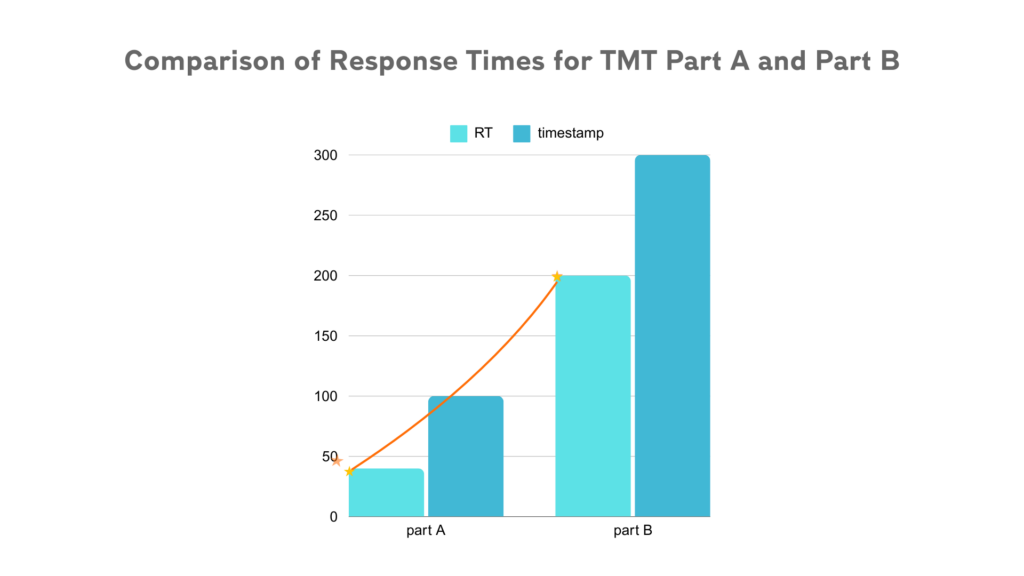
When participants transition from Part A to Part B of the TMT, they often experience an increase in response times and error rates. This increase indicates the cognitive demands associated with task-switching. Essentially, participants need to disengage from the simple task of connecting numbered circles and engage in the more complex task of alternating between numbers and letters and keeping track of their sequences.
Switch costs are a hallmark of cognitive flexibility, reflecting the brain’s ability to adapt and reconfigure mental processes in response to changing task demands. Individuals with higher levels of cognitive flexibility typically exhibit smaller switch costs and are more efficienct in transitioning between mental sets.
Moreover, the magnitude of switch costs can vary depending on individual differences and contextual factors. For example, younger adults may demonstrate smaller switch costs compared to older adults, reflecting age-related changes in cognitive flexibility. Additionally, individuals with traumatic brain injuries or neurodegenerative diseases may show higher switch costs due to impaired executive functioning.
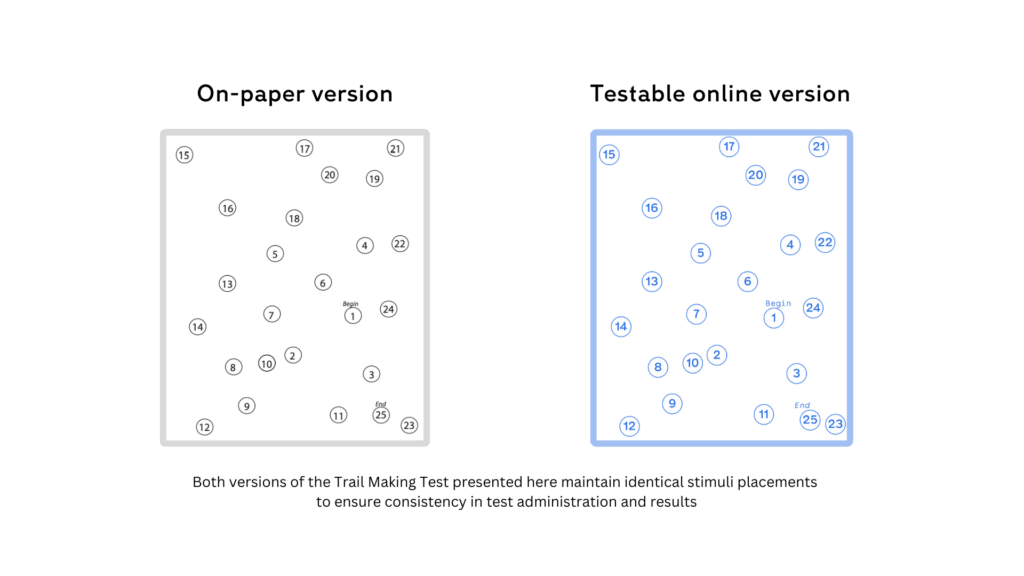
In the Testable version of the Trail Making Test, participants complete the full assessment in just two trials. Importantly, the circle placement mirrors the standard TMT format, ensuring consistency in administration and scoring methods.
At the start of the experiment, participants receive detailed instructions for both parts of the test and informed that they have a total of five minutes to complete both tasks.
After completing both parts of the TMT, Testable automatically saves response times and errors. You can easily export this data and analyse it to assess the participant’s cognitive flexibility and processing speed.
Where to find the Trail Making Test in Testable
You can find the TMT template in our Library. It is ready to run. Import it to your account and start collecting data immediately or customize it first. You can fully customize experiments in Testable, and access them in all browsers.
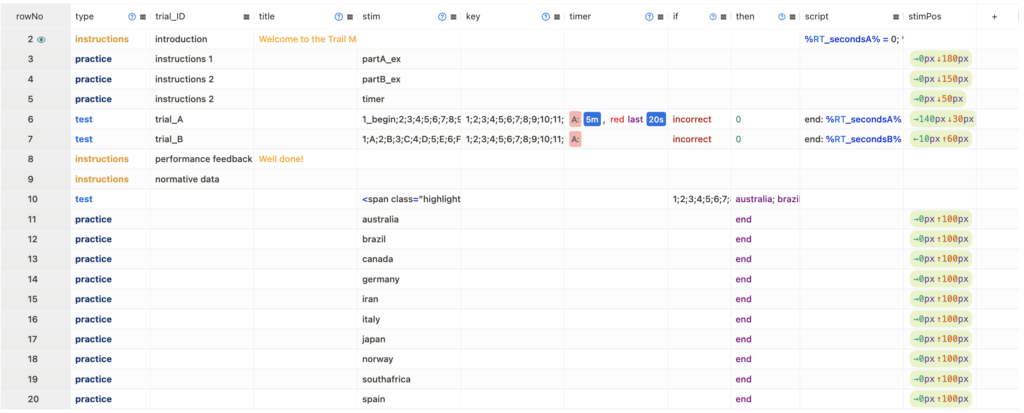
The trial file has all the information Testable needs, formatted in a simple spreadsheet. You can edit it using any spreadsheet editor like Google Sheets, Excel, or Testable’s built-in editor.
Here are two ways you can tailor the TMT experiment:
After making your changes, save and upload the modified trial file to your experiment’s trial file section.
Once you import this template to your library, collect data by sharing the unique experiment link (e.g., tstbl.co/xxx-xxx) with participants. Once participants complete the experiment, their results will appear in the ‘Results’ section of your experiment.
Testable automatically records participants’ response time (the “RT” column in the results files) and accuracy (in the “correct” column). If participants correctly connect all circles in the right order, the trial’s accuracy is marked with 1. If the sequence of responses is incorrect, the trial’s accuracy is marked with 0.
You also receive detailed response times for each key press during the trial (‘RT_keys‘ column) and the ‘timestamp’ for when each trial has ended.

When analyzing the results from the TMT, here are the key aspects to focus on:
correct column is 1. In our example, the participant submitted an incorrect sequence in the TMT part B (trial in row 7) and was promoted to repeat the trial. Therefore, the correct trials to focus on are trial_A (row 6) and the second attempt of trial_B (row 7_2).RT column. If you prefer working with values in seconds, you can extract these from the tallies column, which records the data from our custom script designed to convert RT to seconds for display purposes.RTkeys column for detailed response times of each key press during the trial as longer times at specific points may indicate areas of difficulty or hesitation, for example.Now, the true power of the TMT lies in analyzing the difference between the RT for Part A and Part B. This difference, often called the “switch cost” reflects the participant’s cognitive flexibility and ability to shift between different cognitive demands. A larger difference in RT between Part A and Part B indicates difficulties in cognitive switching. These difficulties may be associated with various neurological or neuropsychological conditions.
Typically, response times on Part B are longer than on Part A because of the additional cognitive demands involved in task switching.
To determine the switch cost subtract RT in trial_A from RT in trial_B.
We should compare individual performance to normative data tailored to factors like age, education, and cultural background. Therefore, if the study includes German participants, referring to normative data specific to the German population or similar cultural contexts can provide more accurate insights.
***
The Testable version of the TMT records RT in milliseconds and converts it to seconds for comparisons. The template includes custom code for this conversion and provides participants with performance feedback (see ‘script’ column).
After completing the test, participants can review their performance against normative data categorized by their country of origin, if available.